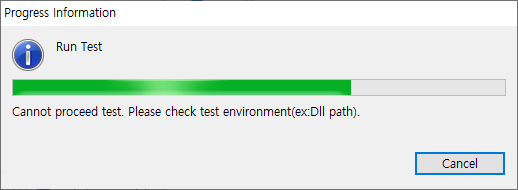
Occasional errors occur when performing tests on CodeScroll Controller Tester. At this time, the user can find out the cause of the test error by checking the debug information of Controller Tester.

Debug information verification can be performed even if the test fails. When you execute the [Inspect Debug Info] of the generated test case, the stack trace is displayed in the [Inspect Debug Info], and you can know where the test failed.
In some cases, after performing a test in Controller Tester, error results such as Signaled and Abnormal Exit are displayed. When you execute the [Inspect Debug Info] of the failed test case, the function call stack trace is displayed in the [Debug Information View]. If you added a variable/expression to debug, a list of executed variables/expressions is also displayed.
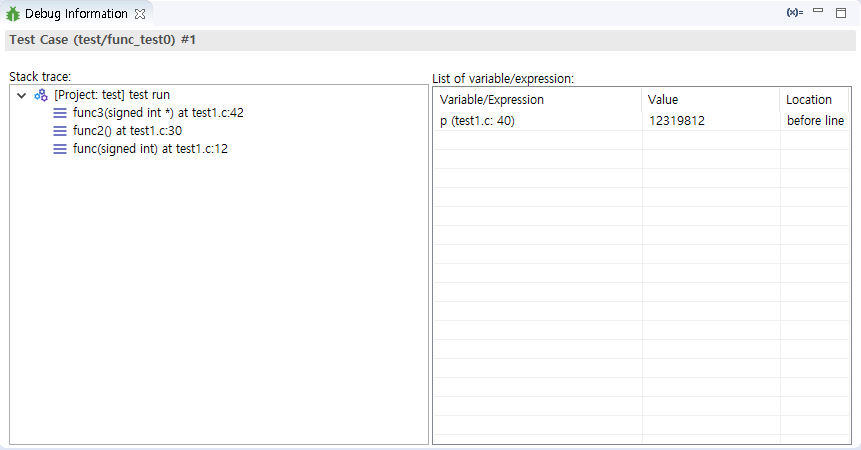
The Stack trace indicates the order of the function calls. The location where the function was called is recorded, and the last execution location is recorded at the top of the Stack trace.The List of variable/expression represents the variable/expression values executed with the test case. The list of variables/expressions added to the entire source code can be checked in [List of Variable/Expressiont] in the toolbar menu of [Debug Information View].
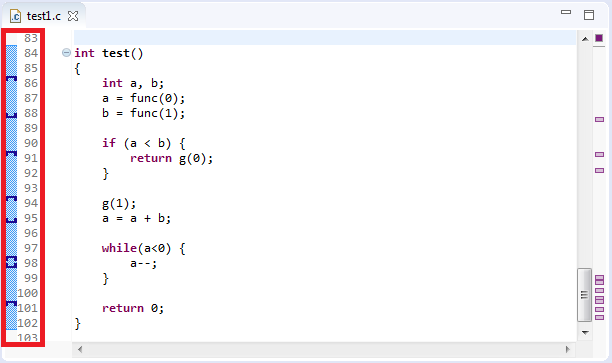
You can also check the variable/expression information to debug in the marker in the source code editor. When you add a variable/expression to debug, the additional position is expressed as a marker in the source code editor, and when you mouse over each marker, you can see the list of variables/expressions added at that position.If you select a test case that contains debug information, each marker displays the result of the variable/expression executed by the test case.
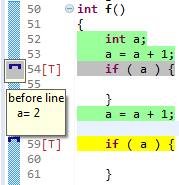
The stack trace and the executed variable/expression value can be used to identify the cause of the error in the test case that executed [Inspect Debug Info].